Summary
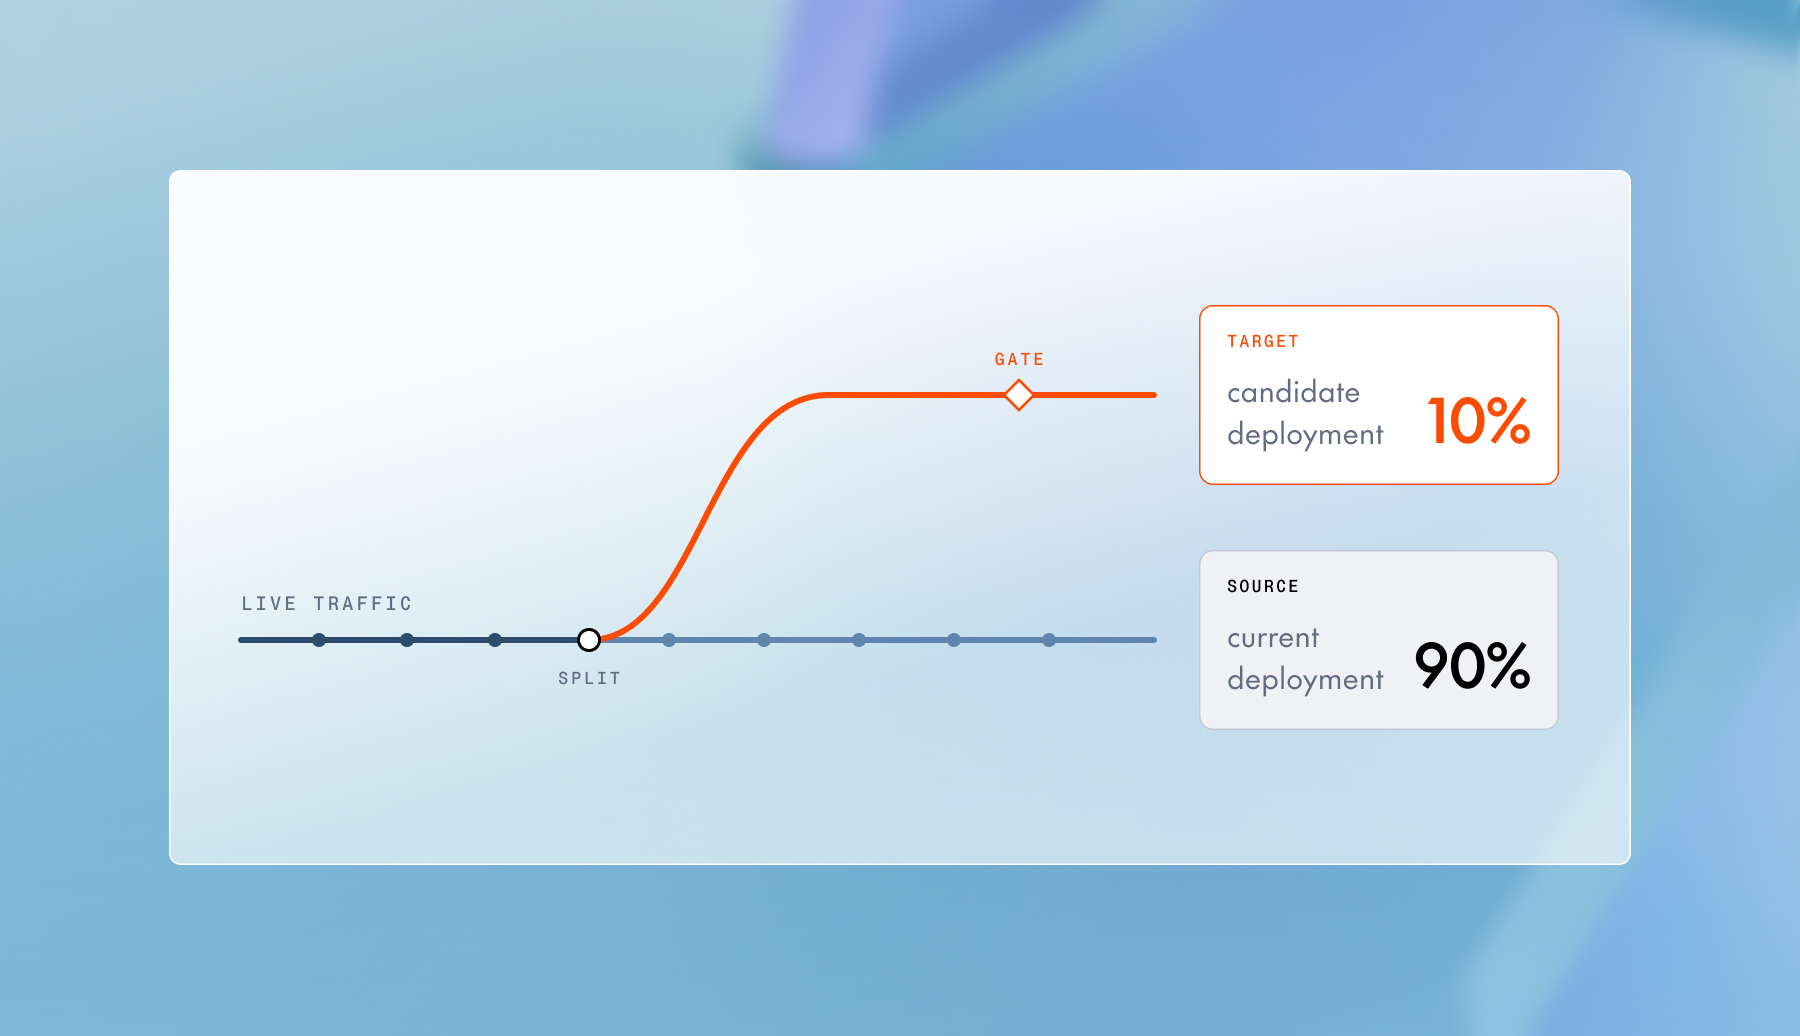
Rollouts move live traffic from your current model to a new checkpoint in gated steps. Health checks always run before traffic moves; on a canary you can also add metric gates (say p95 latency or error rate) that run after each step. If a gate trips, the rollout pauses at the canary share and you cancel it and run it in reverse. Below we run one for real: a Qwen2.5-7B → Qwen3.5-9B canary whose gate caught a 137% p95 regression at 10% of traffic; we canceled and reversed it with live requests served and none failed.
Swapping models is common practice
If you run a model in production, you already know the need to swap in a new checkpoint or a new model family: the open model ecosystem moves fast, and the candidate usually looks great in evals or promises better throughput. You want it in front of every user without hiccups, and a way to rollback if it disappoints. The usual options force a tradeoff:
- Hard swap: point the endpoint at the new model and every user is exposed at once. If p95 doubles, you find out from your dashboard or, worse, from your customers, and you roll back under pressure onto a cold-started old model.
- DIY staged cutover: a second deployment plus a script that nudges traffic percentages while you watch Grafana, remembering to scale the old deployment back up before you shift traffic back.
Both of these options put a human in the loop as the safety mechanism. Rollouts move that mechanism into the platform: you describe the source, the target, the steps, and what "healthy" means, and the platform works against this plan at every stage.
How rollouts work
A rollout migrates traffic between two deployments on the same endpoint: a source (what's serving today) and a target (what you want to serve tomorrow). You pick one of three strategies:
- Canary: traffic moves in staged percentages you define (say 10% → 50% → 100%; the default ladder is 5% → 25% → 50% → 100%), with a wait period and optional metric checks between steps.
- Blue-green: one gated 0% → 100% cutover. You can think of this as a single-step canary.
- Rolling: an in-place, replica-by-replica swap that preserves total capacity. Best when capacity is constrained, especially for same-model config changes that don't need a traffic ramp.
Here's what happens inside every canary step:
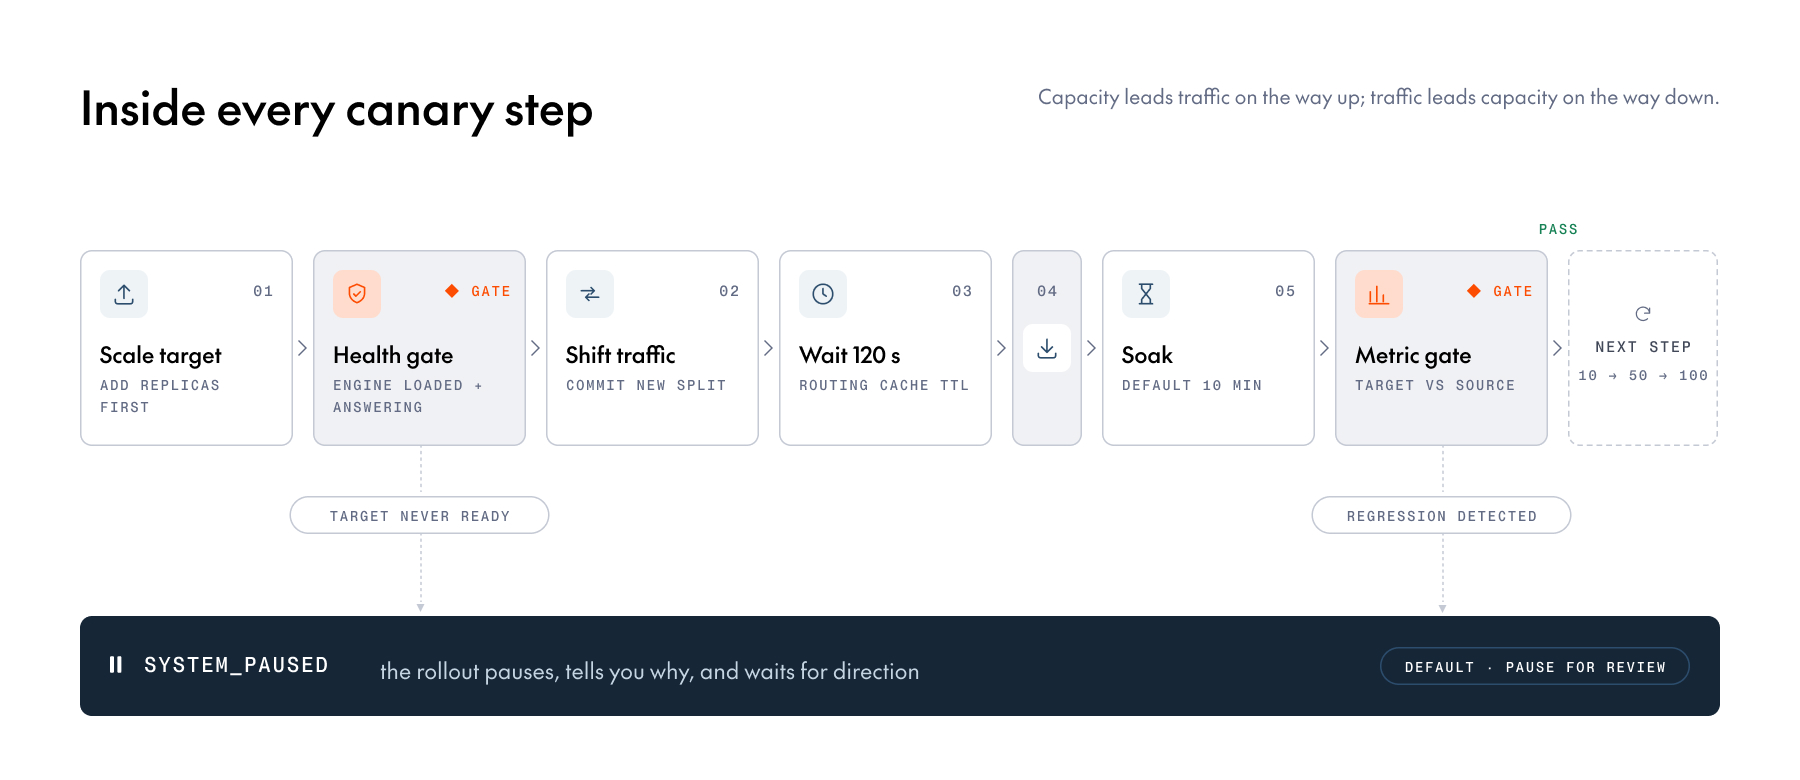
We chose this ordering deliberately; each item prevents a class of incidents:
- The target scales up before any traffic moves. No capacity for the new deployment means no redirected requests: the rollout parks first.
- The health gate runs before the traffic shifts. Traffic only reaches replicas whose engine is loaded and answering, not merely started.
- A propagation wait sits between the shift and the drain. Routing caches converge before any source capacity is removed.
- The source drains after traffic has moved. Capacity leads traffic on the way up; traffic leads capacity on the way down.
- The wait period and the metric gate come before the step is recorded as complete. A step that regressed is never marked passed.
Through the API or the console, a rollout is created in a PENDING state and does nothing until you explicitly start it (the CLI's rollout command creates and starts in one step). This two-step create/start is intentional because you can create the rollout, review it (or have a teammate review it), and start it when you're actually watching.
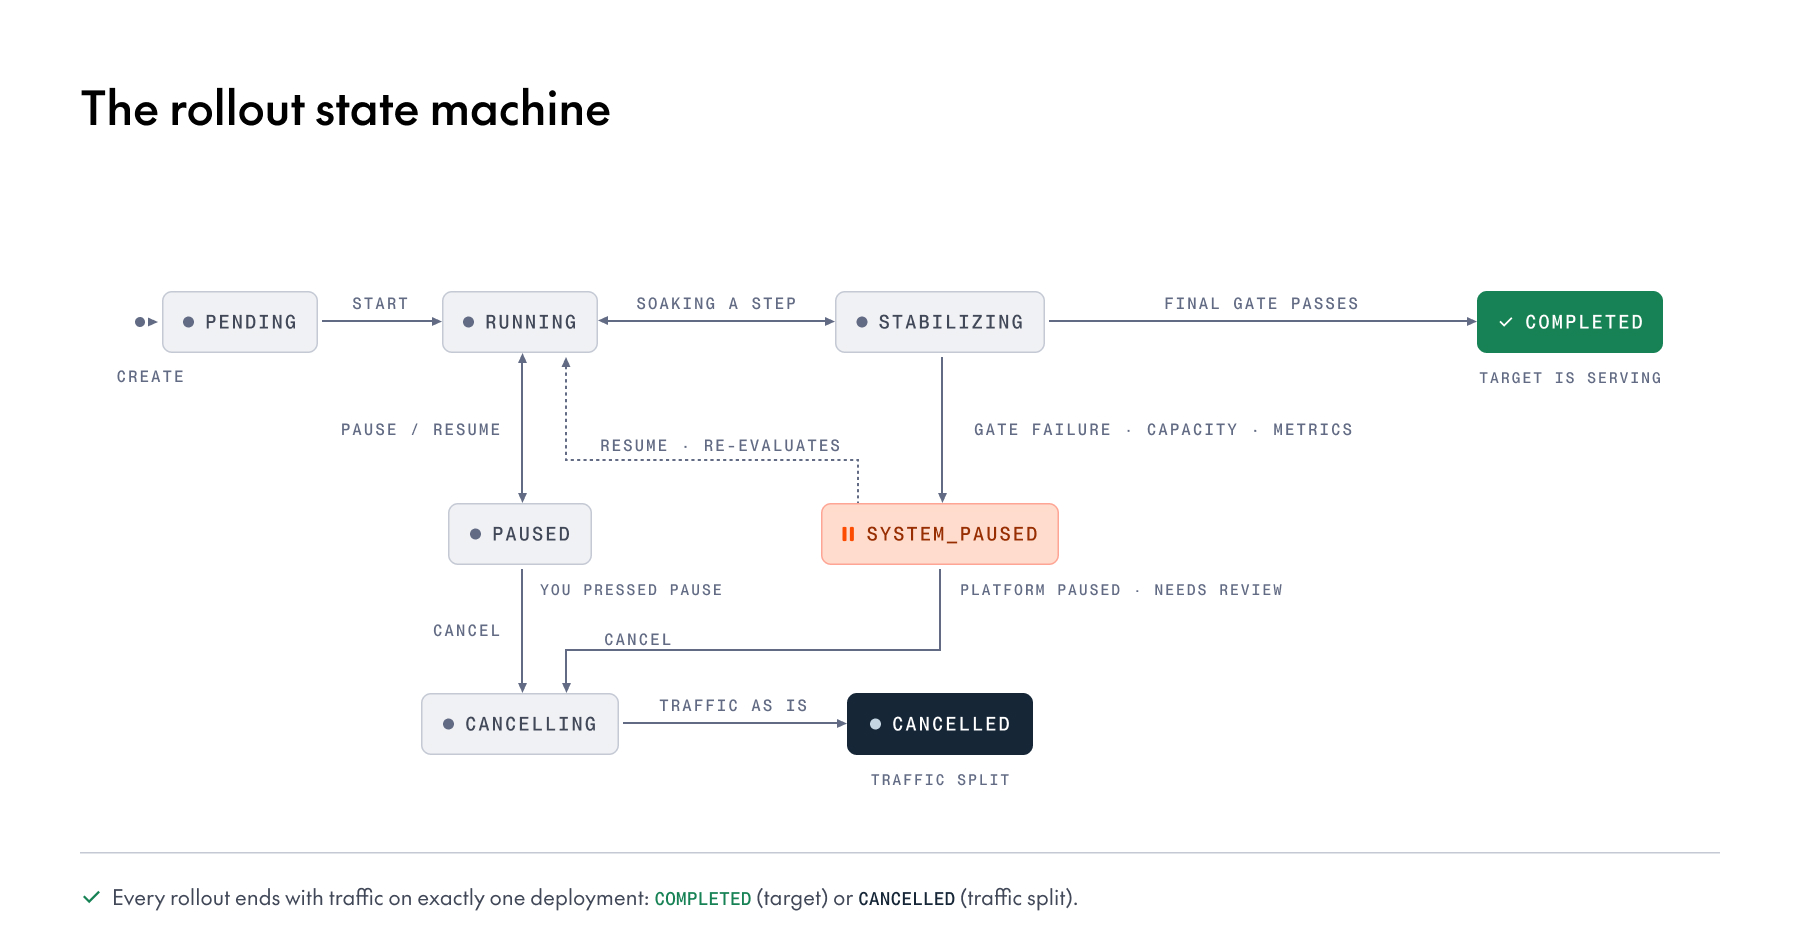
Two states in the diagram above deserve a note:
PAUSEDmeans you pressed pause. The rollout holds exactly where it is and resumes from the same step.SYSTEM_PAUSEDmeans the platform found something that went wrong, such as a failed metric gate, a capacity shortfall or missing metrics, and stopped to wait for human approval. It pauses, notifies you and waits; canceling is always your call.
There is no FAILED end state that leaves traffic in limbo: a rollout ends COMPLETED (the target serves) or CANCELED (the split is frozen where it was, and you run the rollout in reverse to go back).
Anatomy of a step
The following is a breakdown of what happens in a single canary step, measured on the run at the end of this post (Qwen2.5-7B → Qwen3.5-9B on one H100 each).
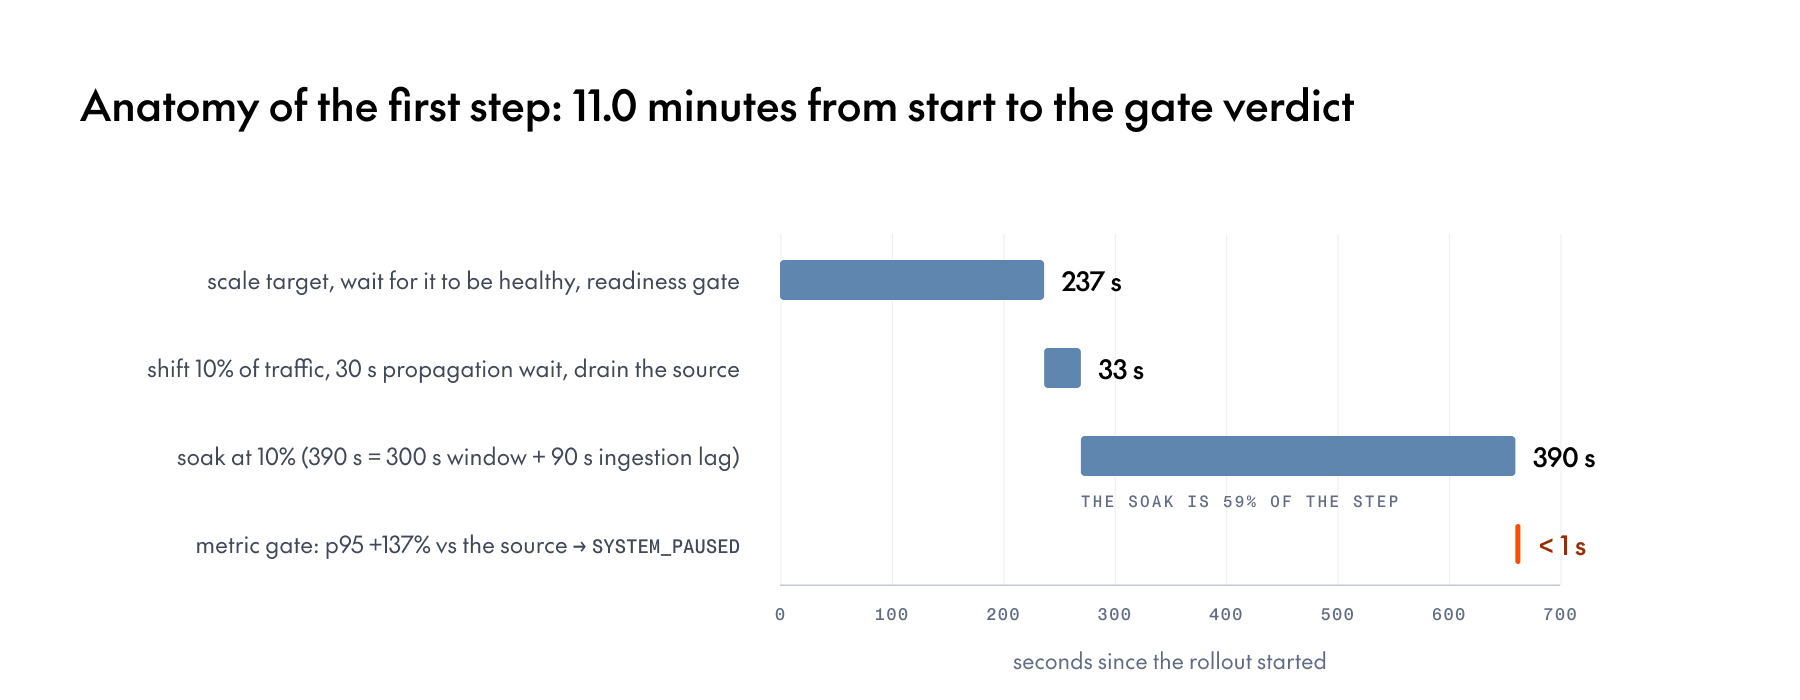
The propagation wait is what keeps stale global routing caches from sending requests to a shrinking source. The wait period is grown to the metric window plus ingestion lag. The cold start dominates the first step; later steps add replicas to a target that is already serving and warm.
Choosing a strategy at a glance
All three strategies run through the same engine and the same health gates; they differ in how traffic moves, how much extra capacity the overlap costs, and whether there is a wait window for a metric gate.
Creating a rollout
Here's a three-step canary from a deployment serving your current model to one serving the candidate, with a latency regression gate. The CLI ships as tg in the together Python package (2.34.0 or newer). You pass the target deployment; the source is inferred when exactly one deployment is receiving traffic, otherwise pass --source:
The source drains to zero replicas and stops when the rollout completes (--final-source-replicas defaults to 0), and the target lands with the source's replica count as its floor (--final-target-replicas). The CLI attaches one metric gate per rollout; for several rules use the console or the API.
The same via the REST API, where create and start are separate calls and a rollout can carry several metric rules:
A few things the API is strict about: percentile is an integer (95, not "p95"), enum values carry their full prefix (METRIC_STAT_TYPE_*, REGRESSION_DIRECTION_*, THRESHOLD_OPERATOR_*), durations are protobuf strings like "600s", and a metric name outside the catalog is rejected with a 400 that lists the supported names. Draining the source is the default, so there is nothing to pass for it.
The regression check can be understood as: at each gate, compare the target's p95 router latency (the per-request duration measured at the router, in milliseconds) over the last 5 minutes against the source's. If the target is more than 10% worse, don't proceed.
Python SDK
The same rollout from Python, with the together package (2.34.0 or newer). Field names are snake_case here and camelCase on the wire; the SDK translates.
Controlling a rollout
Every rollout accepts the same four controls. An endpoint has at most one active rollout, so the CLI takes the endpoint ID and you rarely need the rollout ID. Each control returns as soon as it is accepted; poll tg beta endpoints get (or the GET endpoint) until the rollout reaches the state you expect. While a rollout is active, including while paused, the endpoint's traffic split is locked and its source and target cannot be stopped or deleted.
Controls on a finished rollout (COMPLETED or CANCELED) are refused. Delete a finished or never-started rollout from the history with tg beta endpoints rm $ROLLOUT_ID; deleting the record does not change the traffic split it left behind.
Under the hood: configuring the gates
Metric gates
Metric gates are a canary feature: blue-green and rolling still run health gates, but the staged metric comparison needs canary's step structure to be meaningful. Gates evaluate over a closed catalog of three router-side metrics, measured identically for source and target (any other metric name is rejected at create time):
router_error_rate: router 5xx responses divided by all inference responses, as a 0-1 ratio (0.02 means 2%)router_latency: per-request duration measured at the router, in milliseconds. It is bimodal (the median attempt is often a fast reject), so gate onp95or higher rather than the meaninflight_requests: concurrent requests per ready replica, averaged over the window (size thresholds per replica, not fleet-wide)
Each rule uses one of two checks:
regressionCheck(relative): "the target must not be more than N% worse than the source." This is the right default for latency, because it self-calibrates: you don't need to know your absolute p95, only that the new model shouldn't degrade it. Setdirectionso the platform knows which way is better/worse.thresholdCheck(absolute): "the target must satisfyoperator, value" (e.g. error rate< 0.01). Use this when you have a hard SLO, or when the source itself might be unhealthy and relative comparison would grade on a curve.
Two recipes cover most services:
Timing windows
Three durations interact, so keep all of them in mind:
window(default 5m): how far back the gate looks when comparing metrics.stepInterval(default 3m): how long each step waits at its traffic level before the gate runs.- Metrics ingestion lag (~90s): the time between a request being served and its datapoint being queryable.
You must wait for a period of at least window + ingestion lag, so that the gate's entire lookback period lands inside the current step's steady state. If you wait for a shorter period than your window, the gate would be comparing metrics that partially describe the previous traffic split. The platform enforces this for you: if you request a wait period that's too short for your window, it increments it automatically. It is still better to design with it in mind: a 5m window needs a 6.5m wait period. With the default 5m window the platform grows the default 3m interval to 390s (6m 30s); if you set your own stepInterval, make it at least window + 90s.
What happens on regression
By default, a tripped gate routes to SYSTEM_PAUSED, which means the system pauses for review. The rollout holds at its current split (the blast radius stays at whatever your canary percentage was), and you decide: resume (the gate re-evaluates), promote, or cancel.
There is no automatic abort: a confirmed regression always parks the rollout for a human, because moving traffic back is itself a change someone should be watching. Recoverable causes such as a capacity shortfall or a metrics-pipeline gap are different: the platform retries those every 15 minutes for up to 3 hours before leaving the rollout paused for you. The platform also guards against false alarms: before it pauses on a regression the system re-queries several times over ~90 seconds to make sure it isn’t looking at ingestion lag or transient blips, and a gate that cannot get trustworthy data pauses with METRICS_UNAVAILABLE rather than counting as a regression.
What the platform guarantees
All three strategies run through the same step engine, so these hold for canary, blue-green and rolling alike.
1. Capacity is never rounded down. Target replicas round up and the source drain rounds down, so a same-size swap never has fewer replicas than it started with. Rolling adds one replica mid-step; blue-green briefly runs both deployments at full size. Replicas your autoscaler added above the plan are kept.
2. Traffic never lands on capacity that is not ready. Every step runs in one order: scale the target, check health, shift traffic, wait 30 s for routing to converge, drain the source, wait, evaluate the gate, record the step. A step that regressed during its wait is never recorded as passed.
3. Each side always has the replicas its share needs. Traffic moves only once the target has enough ready replicas for the new share, and the source is never drained below its remaining share. If a replica dies and the split can no longer be served, the rollout holds the largest split it can and pauses as UNDER_SERVED.
4. The rollout raises floors; it does not fight your autoscaler. Each step writes each deployment's minimum replicas and nothing else, with one exception: the target's maximum is lifted once so it can carry the whole endpoint, and stays lifted. The source's maximum shrinks with its share during the drain. Lower a maximum below what the step needs and the rollout pauses as POLICY_INFEASIBLE instead of overriding you.
5. The gate always returns a verdict. A regression check passes when the target is within your percentage budget of the source. No source data passes; a zero source against a non-zero target on a higher-is-worse metric fails; any other zero source passes. A threshold check ignores the source and compares the target with your value.
6. Gates read only the current step's traffic, and only enough of it. The wait period is at least the metric window plus about 90 s of ingestion lag, so a 300 s window means a 390 s wait. p95 needs 20 requests in the window and p99 needs 100; with fewer the rollout pauses as METRICS_UNAVAILABLE. Error rate and in-flight requests need one.
Edge cases
1. What if there's no GPU capacity for the target?
The rollout checks feasibility for the entire journey up front, before touching anything, and again at each scale-up. A shortfall pauses the rollout in SYSTEM_PAUSED with a CAPACITY_EXHAUSTED category. At this point nothing has moved and your source is untouched. Resume re-checks capacity and continues if it's freed up. Capacity problems are usually transient, so pausing beats failing.
2. Can I pause indefinitely?
Yes. Pause is not a held connection but rather a first-class state. Rollouts are designed to survive multi-day pauses and resume exactly where they left off.
When the platform pauses a rollout, status.condition carries a typed failure category plus a human-readable message. These include:
The docs list the remaining categories and what to do about each: Troubleshooting rollouts.
Real rollout demo
Everything above is easier to trust after watching it in action once, so here is a run on the current platform (September 2026). We upgraded a live endpoint from Qwen2.5-7B-Instruct to Qwen3.5-9B, each on a single H100, while a steady 5 requests per second of chat completions flowed through the endpoint the whole time and every response code was logged. The newer model is the one we wanted; the question a rollout answers is whether it fits the latency budget the old one set. We gave it a 25% p95 budget.
Setup. The 7B was already serving. We added the 9B as a second deployment on the same endpoint with no traffic and no replicas; the rollout starts it when it needs it.
Start. One command creates and starts the canary: 10% → 50% → 100%, with a gate that compares the target's p95 router latency against the source's over a 5-minute window after each step.
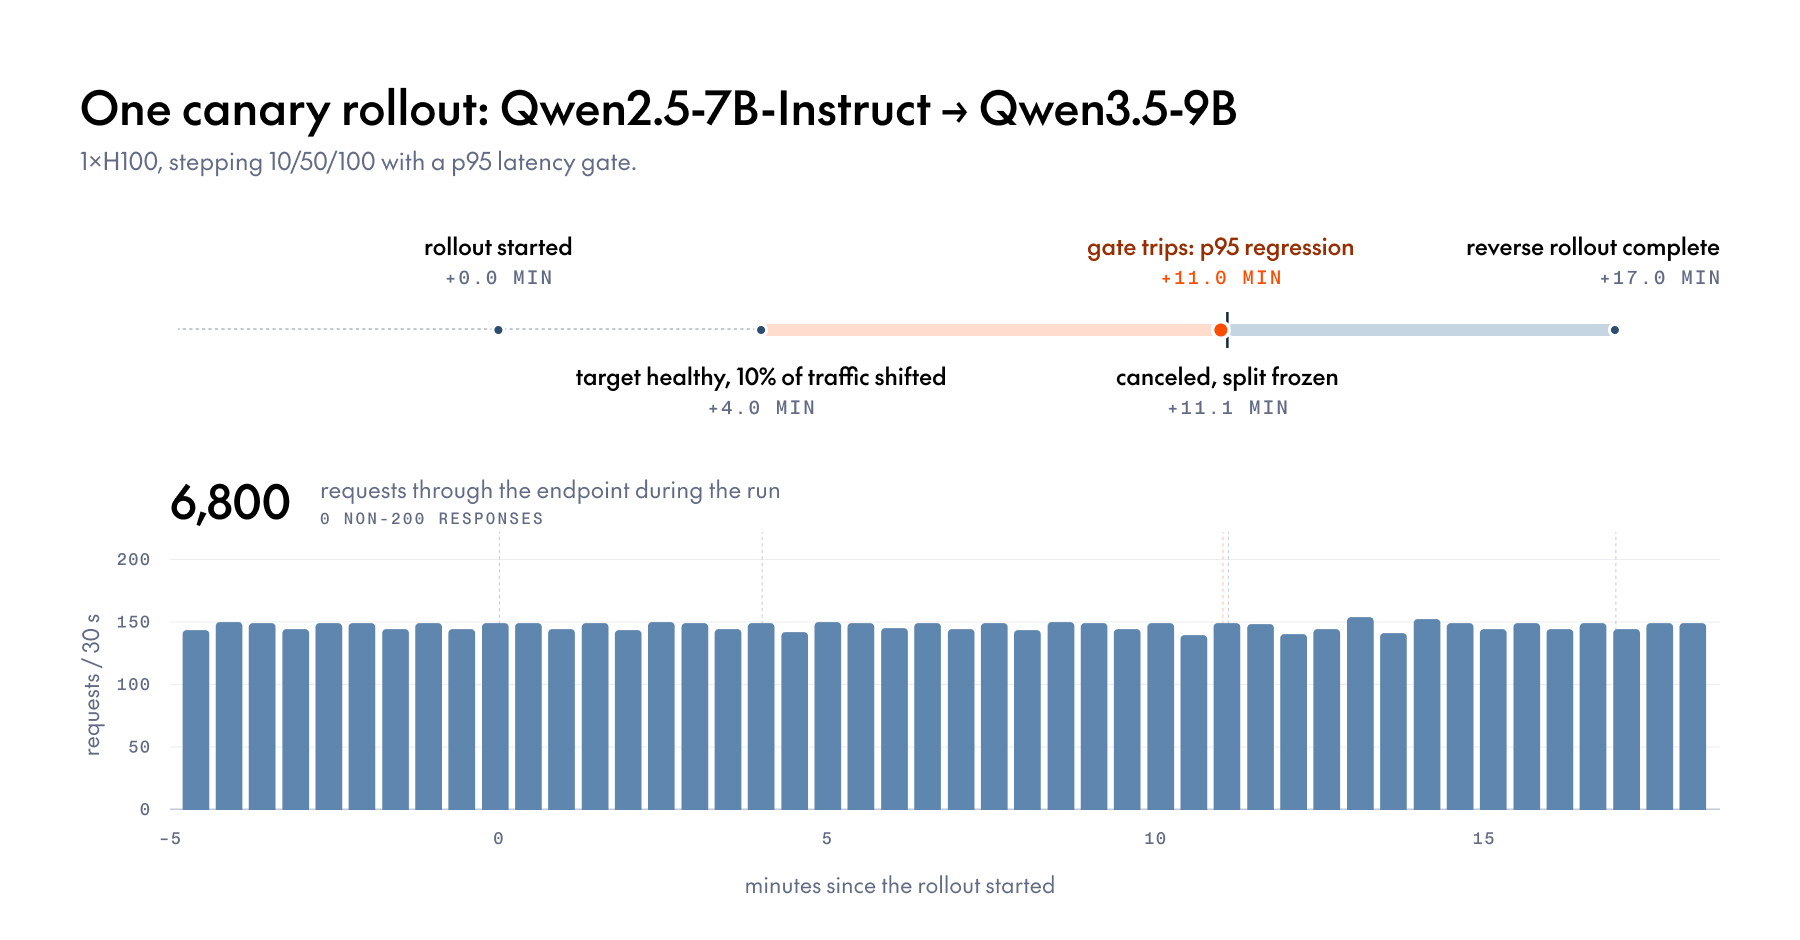
What happened, by the clock (time since the rollout started):
- +3:57 the 9B finished its cold start, passed health checks, and 10% of requests began landing on it. The rollout waited 30 s for routing to converge, drained the 7B's matching share, then soaked. We had left the step interval at its default, so the platform grew it to 390 s to cover the 300 s window plus ingestion lag.
- +11:00 the gate evaluated and tripped. The 9B's p95 router latency was 1,740 ms against 734 ms on the 7B, a 137% regression against the 25% budget. The rollout moved to
SYSTEM_PAUSEDwith 10% of traffic still on the target and nothing torn down. This is whattg beta endpoints get $ROLLOUT_ID --jsonreturned (values in milliseconds):
Decide. The regression is real, not a blip: the 9B is a reasoning model and, at the same max_tokens, generates more per request. That is a product decision rather than something to resume past, so we canceled and went back.
- +11:09
CANCELED. The split froze at 90/10 within 0.2 s of the command. - +17:00 the reverse rollout completed, 5 min 49 s after it started: 100% of traffic back on the 7B, the 9B drained to zero and stopped. Most of that time was a second 7B replica cold-starting, because after a cancel the default final replica count is the pair's combined count.
The probe's verdict across the whole run, including the shift, the pause, the cancel and the reverse: 6,800 requests, 0 non-200 responses.
Audit trail. Every step above is in the endpoint's event feed, filterable by rollout ID:
20:39:45  rollout.created           canary rollout created: dep_src → dep_tgt, 3 step(s) to 100%
20:39:45  rollout.started           rollout started: step 1 of 3 targets 10% traffic
20:43:42  rollout.traffic_shifted   0% → 10%   target traffic: 0% → 10%
20:50:45  rollout.system_paused     paused automatically at step 1 of 3: a metric check failed
20:50:54  rollout.canceled          cancel requested; traffic will be frozen at the current split
20:50:54  rollout.canceled_complete canceled: traffic frozen at 90%/10% (source/target)
An earlier run in July, with a deliberately impossible threshold gate, produced the same shape: a trip at 10% of traffic and 1,198 probe requests with zero errors through the recovery.
Try it yourself!
1. Two deployments on one endpoint. Keep your current deployment as the source and add the candidate as a target with zero traffic. pip install -U together (2.34.0 or newer) gives you the tg CLI:
2. Create and start a canary with the default ladder (5% → 25% → 50% → 100%) and one router_latency regression gate:
3. Watch it with tg beta endpoints get $ENDPOINT_ID (or the endpoint's Rollouts tab in the console) as it progresses through the steps. Pause, promote or cancel it with tg beta endpoints rollout $ENDPOINT_ID --pause | --promote | --cancel.
Throughout, the endpoint URL and your clients stay unchanged; only the model behind them moves.
📚 Docs: Start a rollout · Gate rollouts with metrics · CLI reference · API reference: Create a rollout





.png)




.png)
.png)













.png)